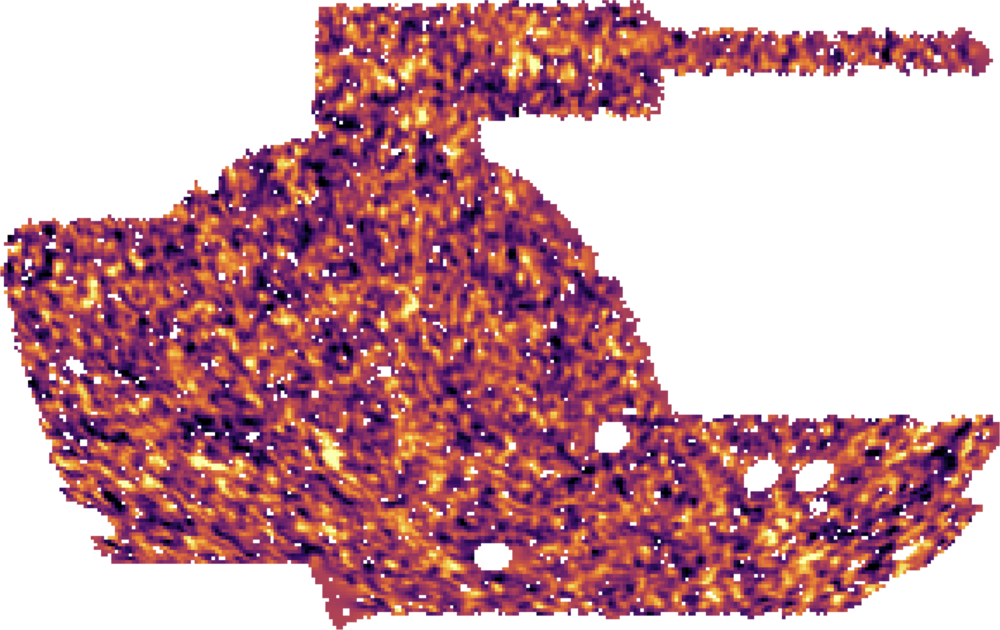
DES Year 3
5,000 deg², 4 tomographic bins, 100 million galaxies. Kaiser–Squires convergence maps.
JEFFREY ET AL. 2021


with important contributions from Marco Gatti, Lorne Whiteway, Ben Wandelt, Judit Prat, Ofer Lahav and the DES Collaboration
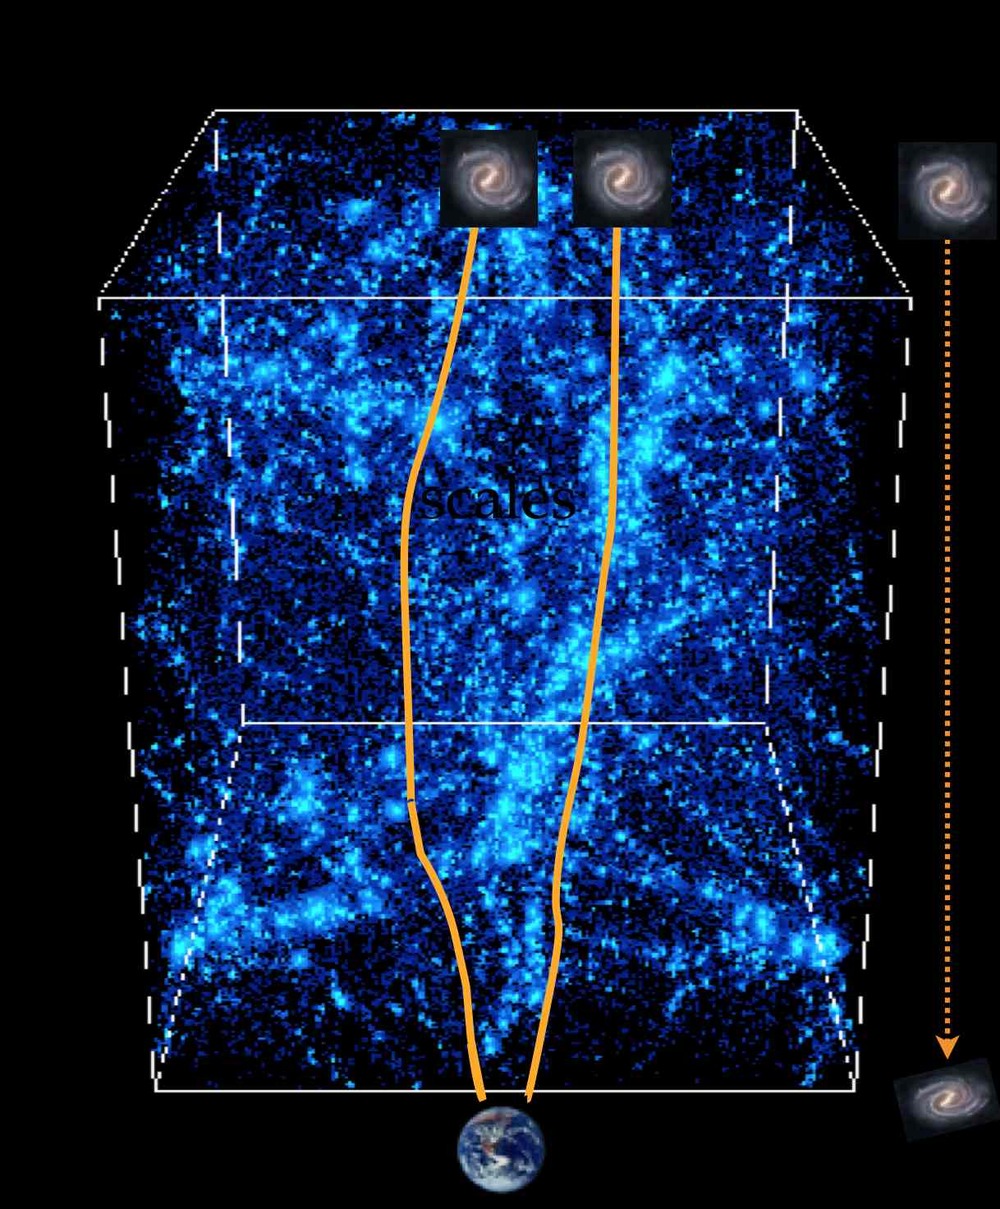
Cosmic shear distorts distant galaxies by ~1%. That distortion is sensitive to the growth rate of structure and to the distance–redshift relation — so it constrains

But the two-point function is not the whole story:
The goal: extract more information than the power spectrum — and be able to say how much more.
“Information theory and the study of communication…”
“…statistical and quantum mechanics.”
“Compression is intelligence”
A model that predicts well is a model that compresses well.
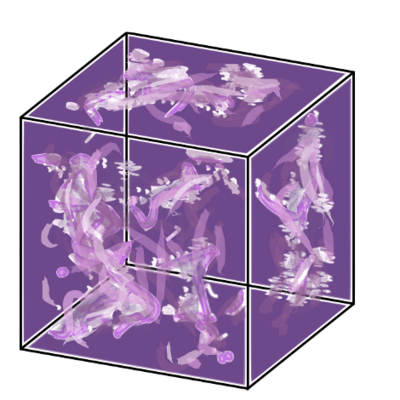

We need encodings of the data that are informative about theory parameters and well-understood observables.

ρ = 0. The joint factorises, p(x,y) = p(x)p(y). Knowing Y tells you nothing about X.
ρ = 0.5. The conditional narrows — Y carries some information about X.
ρ = 0.9. The conditional is far tighter than the marginal. Y pins X down.
ρ → 1. All the mass collapses onto a line. I → ∞: X is determined by Y.
MI is a highly nonlinear function of the distribution (cf. correlation) — and hard to estimate from samples.


The chain rule lets us add information sequentially, never double-counting what an earlier summary already captured.
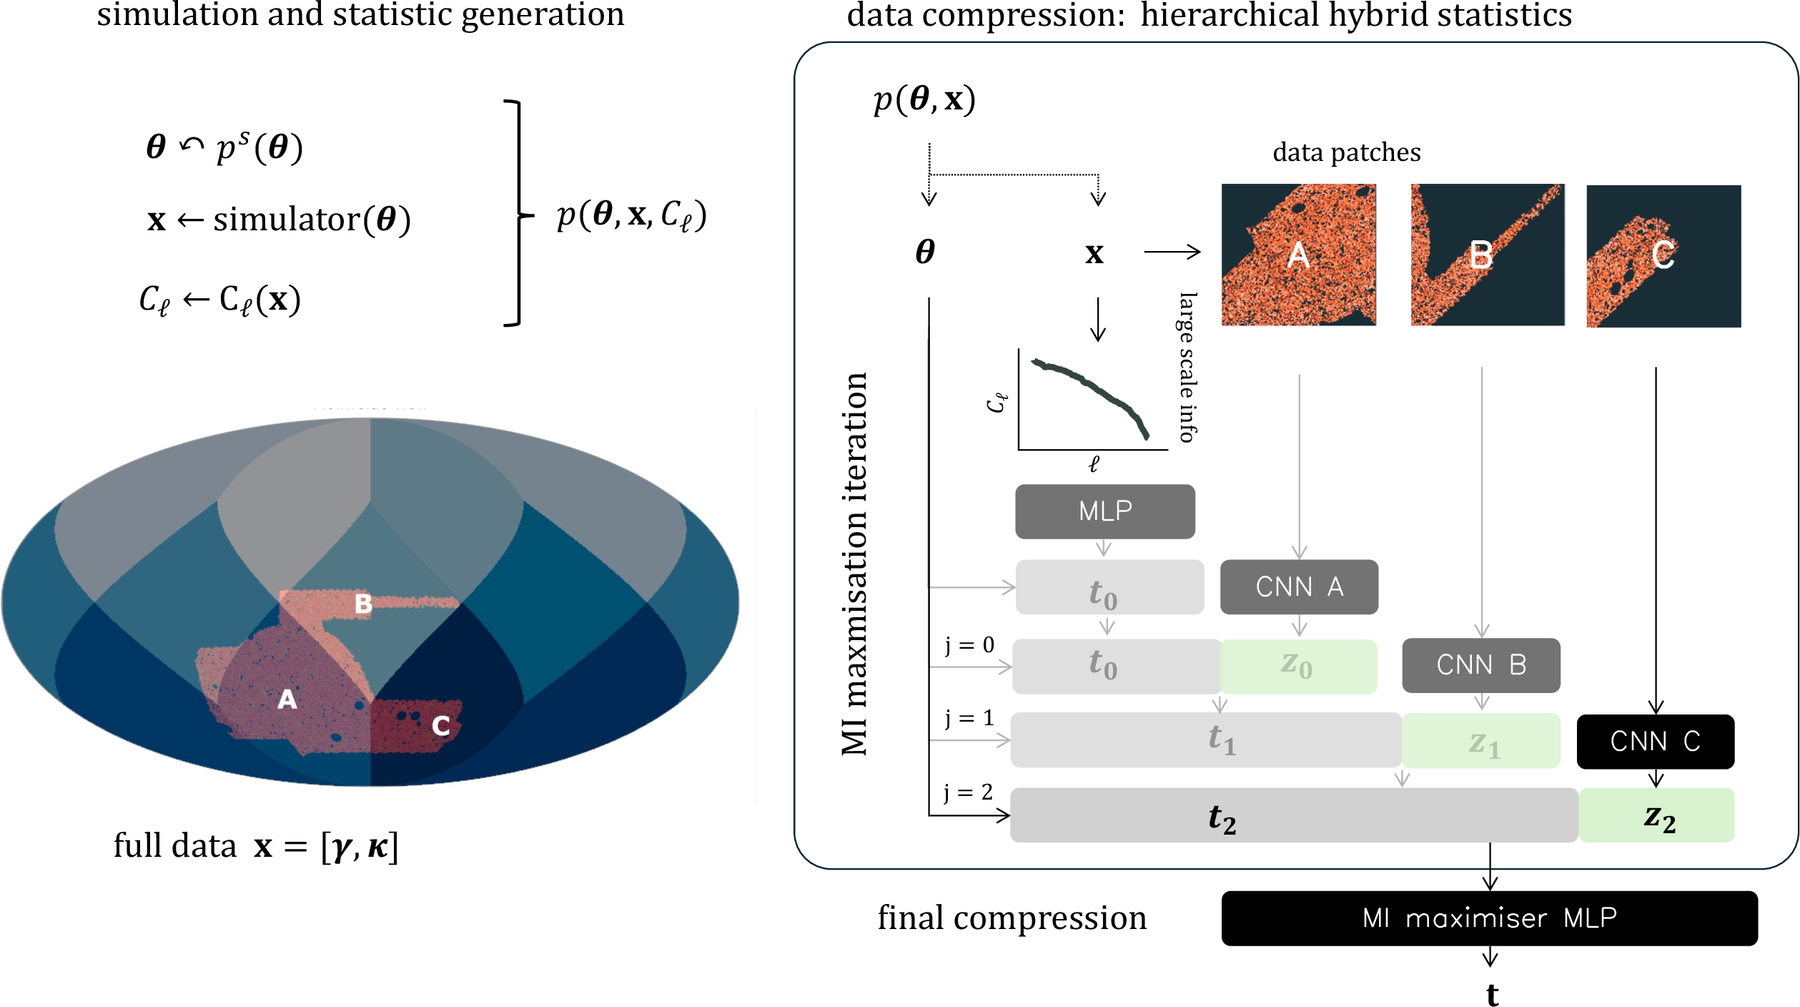
5,000 deg², 4 tomographic bins, 100 million galaxies. Kaiser–Squires convergence maps.
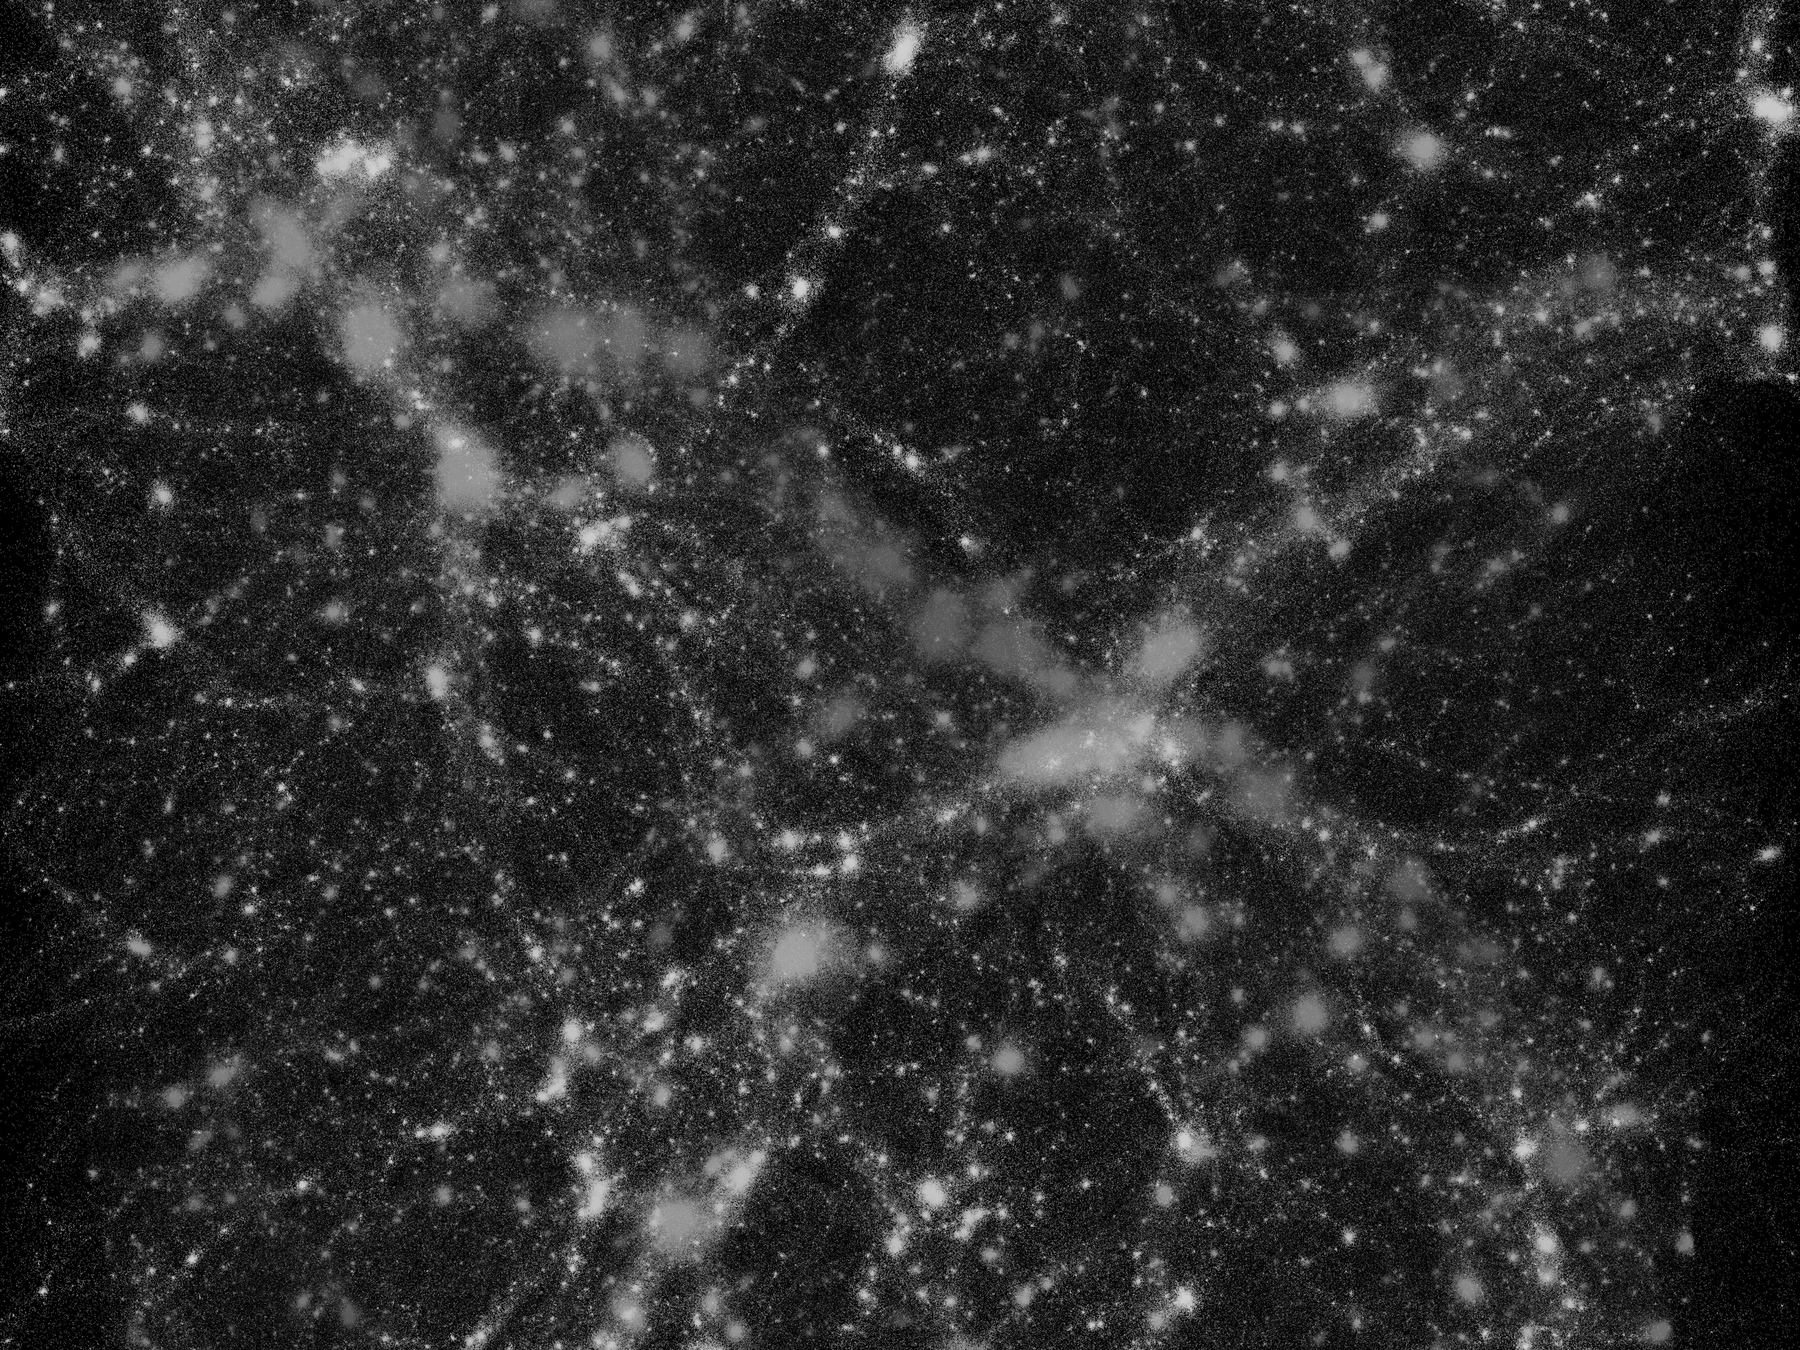
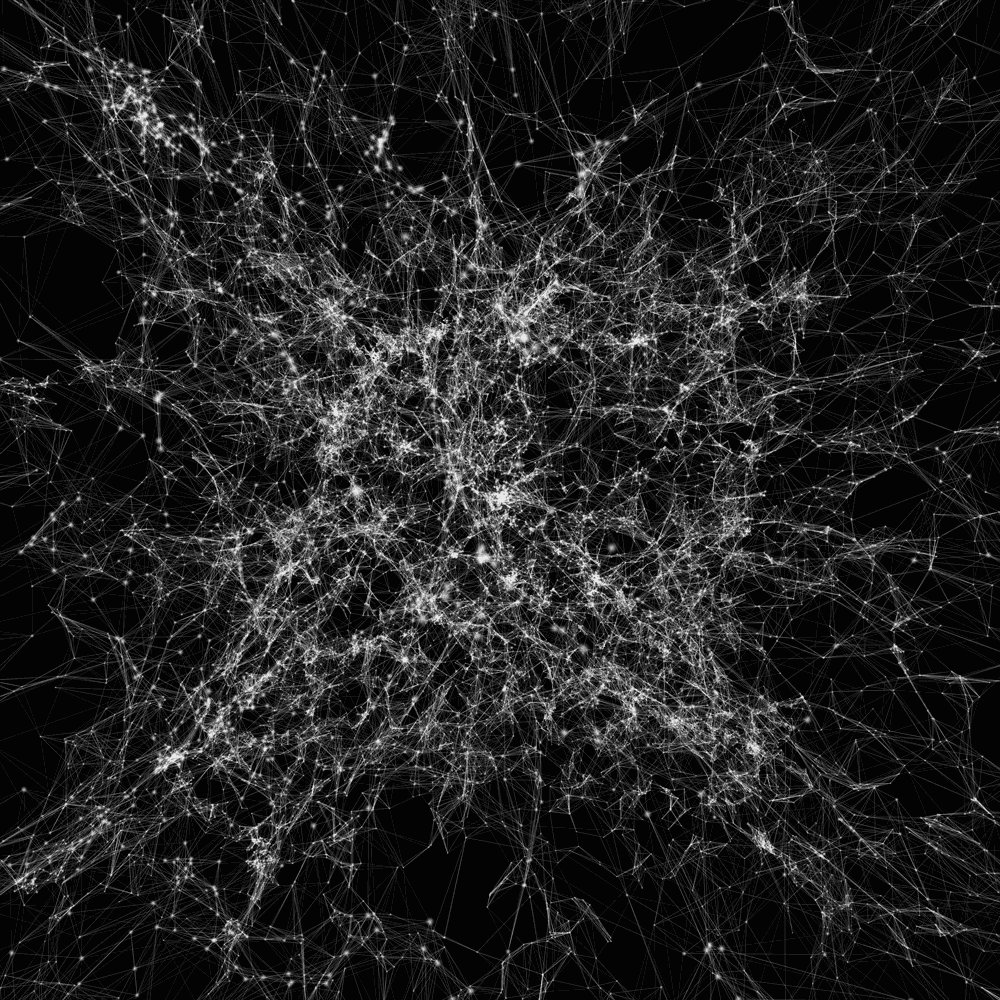
wCDM, 1080³ particles, 12,600 mock surveys — with intrinsic alignments, shear bias, source clustering and n(z) errors forward-modelled.
Maps subject to DES ℓ < 1024 scale cut.
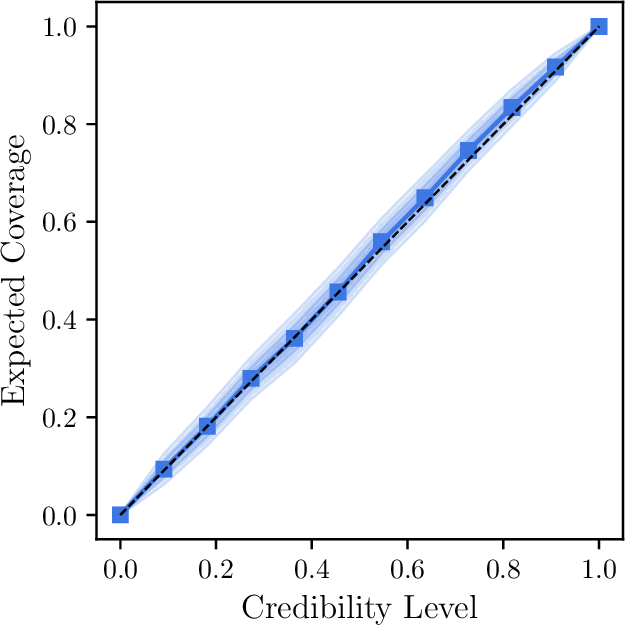
Credible regions are unbiased — the posteriors mean what they say.
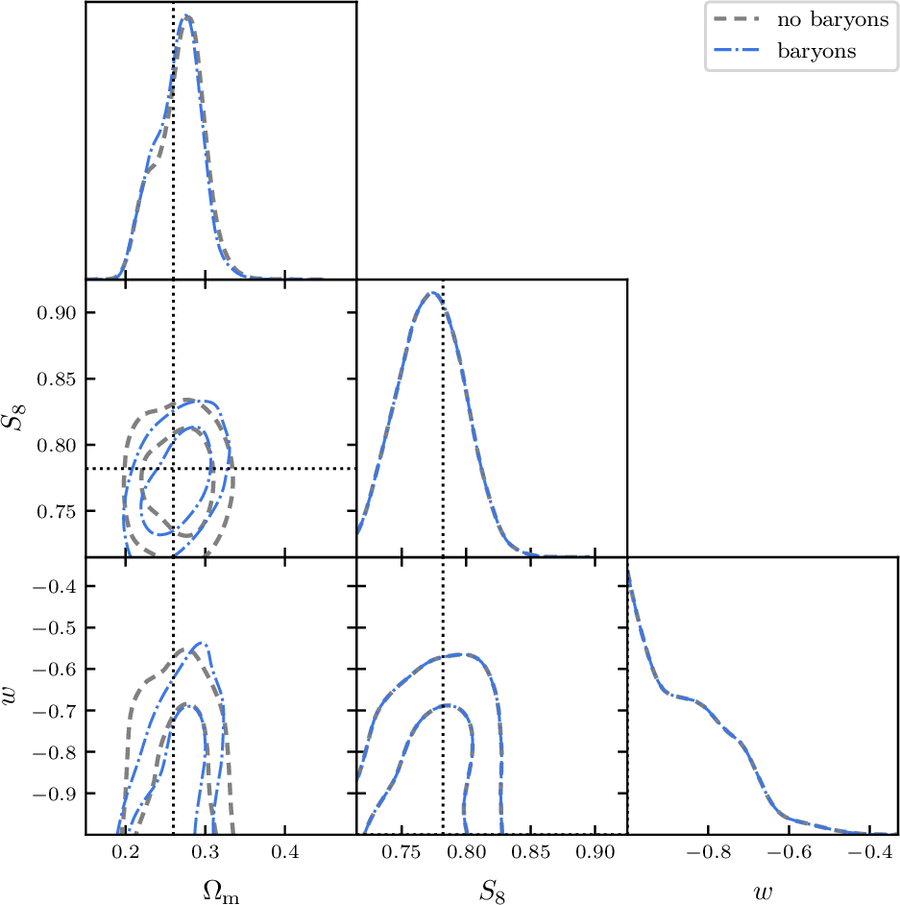
Re-analysed with baryonified CosmoGridV1: posteriors shift by < 0.3σ.
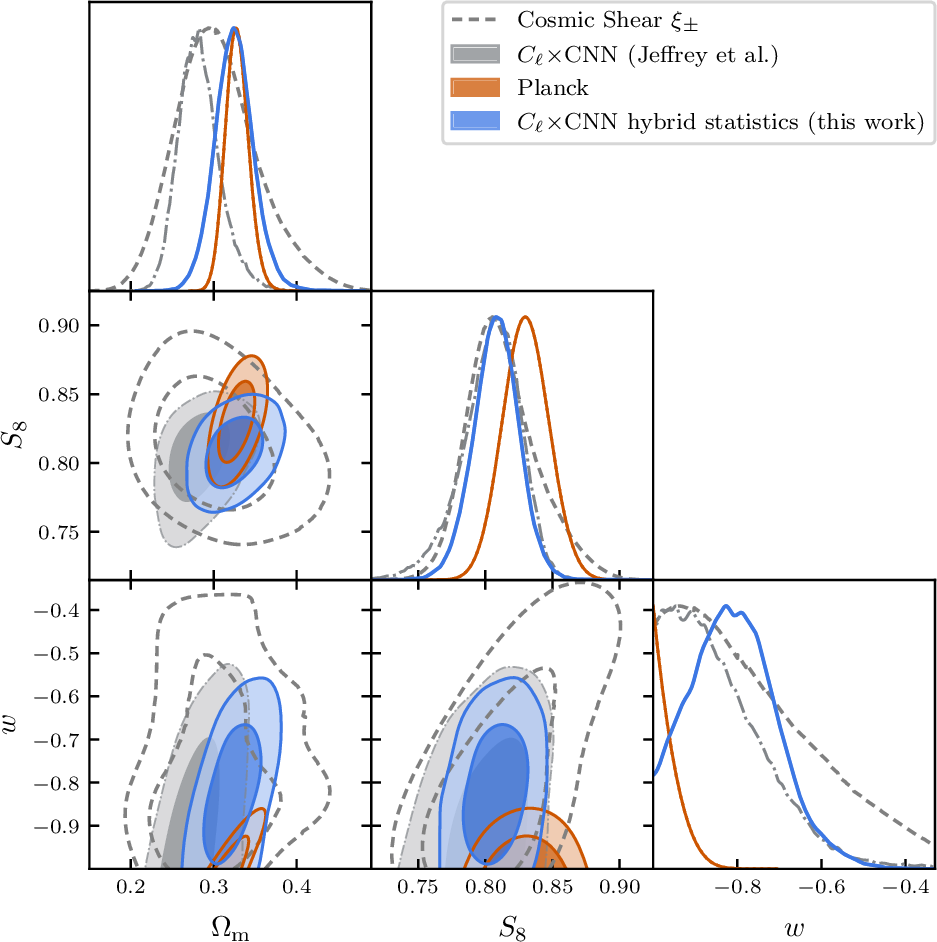
68% MARGINAL CREDIBLE INTERVALS
Precise agreement with Planck in both S8 and Ωm, and fully consistent with ΛCDM.
Alan Heavens · Natalia Porqueres · Josh Williamson · Niall Jeffrey — with Marco Gatti, Lorne Whiteway, Ben Wandelt, Judit Prat, Ofer Lahav and the DES Collaboration
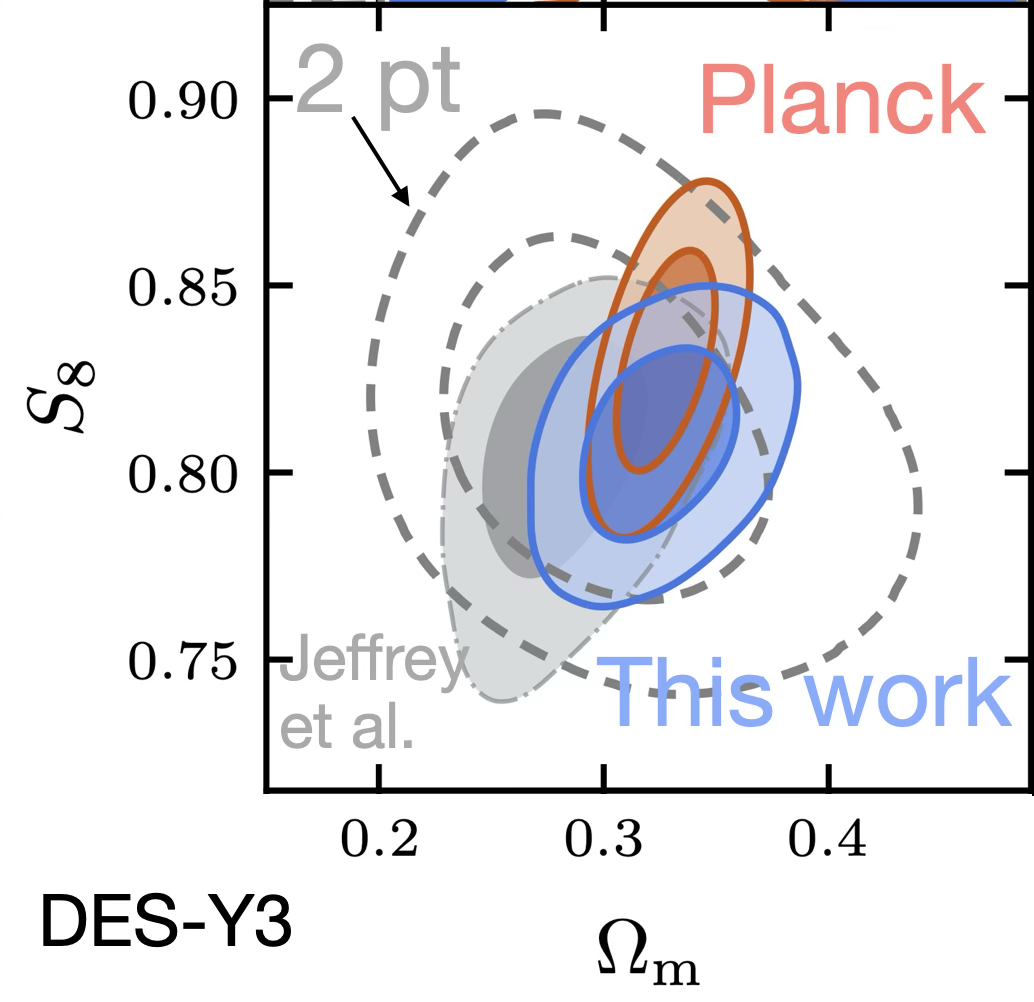
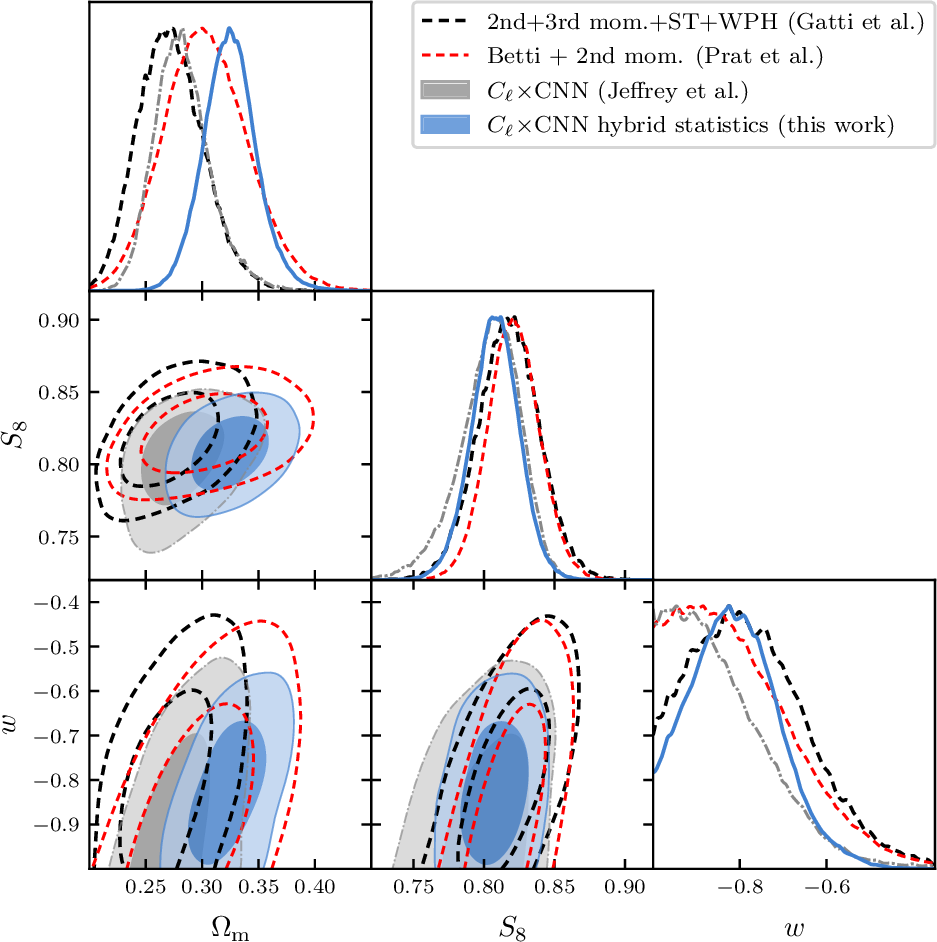
All four analyses use the same DES Y3 data, the same Gower Street simulations, the same forward model and the same analysis priors. The spread between these contours is therefore only the effect of changing the summary statistic.